El Niño
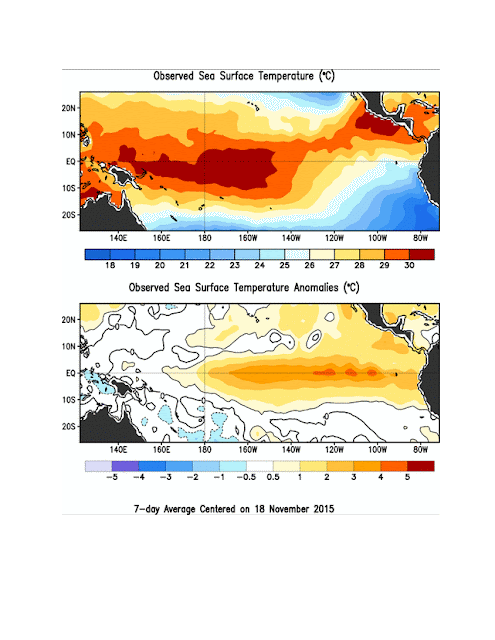
The current El Niño is on track to be one of the largest on record (since 1950). This past week's sea surface temperature (SST) anomalies (figure 1) were much above normal with some peaking at 3°C above normal. Although these values are unprecedented, it is not indicative of the events strength. The Climate Prediction Center compares historical El Niño episodes based off of their 3-month SST anomaly mean. The latest Oceanic Niño Index was a 3-month mean over August, September, and October. For this current episode, it was 1.7°C above normal. For comparison, the 1997/1998 El Niño (strongest on record) was 2.0°C above the norm. |
| FIG 1. Sea Surface Temperatures over the equatorial pacific. source: http://www.cpc.ncep.noaa.gov/products/analysis_monitoring/enso_update/sstweek_c.gif |
Southeast Winter Outlook
So, what does this mean for North Carolina? Normally, an El Niño enhances the subtropical jet stream causing storms to track along the southern states of the US. As a consequence, above average precipitation is expected across the Southeast and North Carolina (figure 2).
 |
| FIG 2. Climate Prediction Center 3-month precipitation outlook. source: http://www.cpc.ncep.noaa.gov/products/predictions/long_range/lead01/off01_prcp.gif |
As for temperature, that's a little bit more tricky. Sometimes an El Niño can cause above average temperature, while other episodes cause below normal. This winter season was no exception of a tricky outlook. Most of North Carolina could experience either above or below normal temperatures, while the northern tier will likely experience above normal temperatures within the next three months (figure 3).
