Friday, January 29, 2016

2015 Climate Summary of the Southeastern United States


Highlights

Following a record warm December, 2015 wrapped up with more abnormal climatic conditions. Nearly every state in the Southeast experienced much above normal temperature conditions (Fig. 1) and above average precipitation totals (Fig. 2). Florida, however, was around the precipitation average. Additionally, there were some significant climate anomalies throughout the year. A strong El Nino formed across the equatorial Pacific and peaked towards the end of the year. The North Atlantic hurricane season was slightly below average with 11 named storms, 4 hurricanes, and 2 major hurricanes. In October, Hurricane Joaquin interacted with an upper level low, which lead to historic rainfall amounts across the Carolinas. Around Charleston, South Carolina rainfall amounts were around 15-20 inches with isolated amounts of up to 25 inches. Severe weather swept across the south in late December, which caused tornadoes and record flooding. Lastly, Florida has its warmest year on record with an average statewide temperature of 3.3°F above normal.

Figure 1. Statewide average temperature ranks for January - December of 2015, Source: NOAA/NCEI
Figure 2. Statewide precipitation ranks for January - December of 2015, Source: NOAA/NCEI

Seasonal Analysis 

A prominent trough remained over much of the Southeast during the winter months. Consequently, most of the states experienced a below average winter, while Florida, Georgia, and South Carolina were around normal. Most of the lower Mississippi Valley experienced drier than normal conditions while the other Southeastern states were around normal precipitation totals for remainder of the winter season. 

By spring, the pattern shifted as most of the Southeast experienced above average temperatures and Florida set a new spring temperature record (4.6°F above average). Nighttime temperatures were much above normal, which allowed the average temperature to exceed above normal conditions. As for precipitation amounts, the southeast experienced a mix of climatic anomalies by the end of May. The lower Mississippi Valley had above normal precipitation amounts while Florida, North Carolina, and South Carolina experienced drier than normal conditions. The remaining Southeastern states were around their normal precipitation totals. Additionally, Tropical Storm Ana made landfall on May 10th near Myrtle Beach, South Carolina. Little damage was reported, but heavy rain fell across the Carolinas. 

Florida, Louisiana, North Carolina, and South Carolina experienced much above normal temperature conditions by the end of the summer. Kentucky and Tennessee remained around average temperatures by August while the rest of the Southeastern states were warmer than average. Below-average precipitation fell across the Southeast. Combined with warm temperatures, drought conditions worsened across the lower Mississippi Valley and Southeast. In contrast, above-average precipitation fell across Kentucky, Tennessee, and Virginia. In August, remnants of Tropical Storm Erika moved across Florida, which helped alleviate drought conditions. 

Every Southeastern state had an above-average fall temperature. Florida had its warmest fall on record with the statewide average around 3.6°F above the norm. As for precipitation, every state (except Florida) had above-average precipitation amounts by the end of fall. The historic flooding event in early October caused South Carolina to have its wettest fall on record with 23.76 inches (13.91 inches above average). Due to the rainfall, drought conditions improved across the entire Southeast.

Atlantic Hurricane Season 

Figure 3. 2015 Atlantic hurricane season with storm tracks and strength, source: NOAA National Hurricane Center
The 2015 Atlantic hurricane season had 11 named storms, 4 hurricanes, and 2 major hurricanes (Fig. 3). The season was slightly below the climatological mean. On average, 12.1 named storms occur with an average of 6.4 hurricanes and 2.7 major hurricanes. The lack of activity could be due to the El Nino, which tends to suppress Atlantic hurricane activity.

Two tropical storms made landfall (Ana and Bill) and no hurricane or major hurricane made landfall this season. Hurricane Joaquin did not make landfall; however, it did interact with an upper level low, which caused historic flooding in the Carolinas. This season continued the record-long streak of no major hurricane (category 3 and higher) making landfall. On average, a major hurricane makes landfall every 3 years. The last major hurricane to make landfall was Hurricane Wilma, which was November 24, 2005. 

Severe Weather Season

Figure 4. 2015 tornado occurrences in the United States, Source: NOAA Storm Prediction Center

For the United States, the preliminary report of tornadoes was around 1, 183. This season was below the climatological average, which is 1, 253 annually. Most months were around the climatological mean for tornado reports. However, May, November, and December were well above their respective averages. In May, there were 414 confirmed tornado reports, which is 138 above the average. In November, there were approximately 95 preliminary reports, which is 37 above the average. In December, there were 86 preliminary reports, which is 62 above average. Lastly, in the Southeastern U.S., there were no tornado reports, which was the first time that at least 1 tornado was not reported in the region. 

Reference: 

NOAA National Centers for Environmental Information, State of the Climate: National Overview for Annual 2015, published online January 2016, retrieved on January 28, 2016 from http://www.ncdc.noaa.gov/sotc/national/201513

Wednesday, January 13, 2016

Southeast Climate at a Glance - December 2015

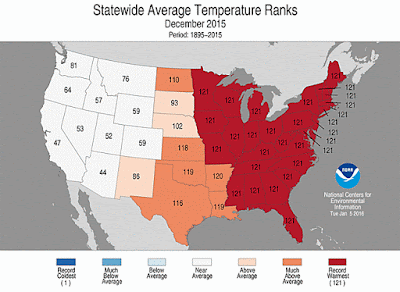
Following a mild November, December 2015 was also warm and wet across the region. The entire Southeast experienced above average temperatures and precipitation totals during December. In fact, many states set new temperature records. Specifically, nine states set December records for their statewide average temperature, maximum temperature, and minimum temperature.

Temperature Summary 

December temperatures were much above average with some locations reaching the 70s and 80s. Many weather stations observed record-breaking temperatures throughout the month. Virginia, Kentucky, Tennessee, North Carolina, South Carolina, Georgia, Florida, Alabama, and Mississippi experienced their hottest December on record (Fig. 1). Most of the region was 9 to 14 degrees F above their mean temperature norm, while southern Florida was 6 to 9 degrees F above their mean. The warmest part of December was the 24th through the 27th as maximum temperatures reached the 70s and minimum temperatures remained in the 60s. The coolest part of the month was the 19th and 20th as minimum temperatures fell below 30 degrees F over most of the Southeast. 
Figure 1. Statewide average temperature ranks for the month of December. Source: NOAA/NCEI

Precipitation Summary

Most of the region observed above average precipitation totals by the end of December. In total, eight states (Virginia, Kentucky, North Carolina, South Carolina, Georgia, Alabama, and Arkansas) observed well above average precipitation totals (Fig. 2). Stations in Alabama, Georgia (except the southeastern quadrant), northern South Carolina, North Carolina, south-central Virginia, the Florida Panhandle, and southern Florida recorded precipitation totals 200 to 600 percent of normal. Stations across central and northern Florida and southeastern Georgia recorded precipitation totals 5 to 50 percent of normal. 
Figure 2. Statewide precipitation ranks for the month of December. Source: NOAA/NCEI

Drought and Climate Impacts on Agriculture

There were no drought conditions (class D1 or greater) present during December. 
There were some damaged agriculture reports across the region. Heavy rainfall events caused flooding over southeastern Florida and damaged winter yellow squash, zucchini, and green beans. In Georgia, farmers were unable to harvest a significant amount of their pecan groves due to saturation. Lastly, lack of cold temperatures (specifically between 32 and 45 degrees F) in Georgia reduced the necessary winter dormancy for peach trees and blueberry bushes. This will likely negatively affect the yield in 2016.  

In Summary

A couple contributing factors to the abnormal December climate is the El Nino and Arctic Oscillation. El Nino tends to enhance the subtropical jet stream, which directs storm tracks along the southern states. An El Nino normally causes above normal precipitation totals across the southern states during the winter months. In regards to the temperature, the Arctic Oscillation was positive for the majority of December. This means that the Arctic air is trapped in the polar region. Consequently, arctic air masses remained north while southerly flow directed warm air in the region causing above normal temperature conditions. 

NOAA National Centers for Environmental Information, State of the Climate: National Overview for December 2015, published online January 2016, retrieved on January 13, 2016 from http://www.ncdc.noaa.gov/sotc/national/201512.


Friday, January 8, 2016

Raleigh December Climate Summary

Winter in the southeastern United States is usually mild, but this past December was far from normal. December 2015 ranked as the hottest December on record average maximum, mean, and average minimum temperature for the Raleigh weather station. Across the entire state, almost every station recorded its warmest December on record for mean temperature and a few others recorded their second warmest. Along with warm temperatures, total precipitation was about 3 inches above normal for Raleigh.

Temperature

The mean average temperature was 56.1F, which is 12.7F above normal! December 2015 ranked as the hottest December ever recorded for Raleigh. Raleigh experienced a few cold days, but overall the temperature was much above normal (Fig. 1). The warmest day was Christmas Eve as the temperature topped at 77F. The average maximum temperature was 65.1F, which is 11.6F above normal. The average minimum temperature was 47.1F, which is 13.8F above normal. 
Figure 1. The average mean temperature during December for Raleigh

Precipitation

The first half of December was relatively dry with only a few light rain events around 0.04". The second half of December was active which caused the total precipitation to surpass the normal amount (Fig. 2). Raleigh received 6.07" of rain, which is 3.00" above the norm. Overall, December 2015 ended with the 11th wettest December on record. 
Figure 2. The total precipitation amount during December for Raleigh

Why was it so warm?

There are many natural climate oscillations that have a big impact on our climate. Studies show that the El Nino-Southern Oscillation influences our climate during the winter months. An El Nino enhances the subtropical jet, which directs storms along the southern states. This pattern normally causes above normal precipitation anomalies along the southern states (much like we observed during December). Another climate oscillation that greatly influenced this past December is the Arctic Oscillation (AO). Studies have shown that the AO impacts our wintertime temperatures. A positive AO indicates that the pressure system is strong, which traps the Arctic air in the north. A negative AO means that the pressure system is weaker, which allows the frigid air to move equatorward. Figure 3 shows that the AO was positive for much of December. 
Figure 3. Arctic Oscillation observations and forecasts. Data source: http://www.cpc.ncep.noaa.gov/products/precip/CWlink/daily_ao_index/ao.sprd2.gif 
Additionally, the surface and upper air pattern directed the warm, moist air from the equator up towards the midlatitudes (Fig. 4). Following a record warm autumn, December was far from normal, too. 
Figure 4. Upper air map at 500 mb. Black lines are lines of constant pressure (isobars), dashed red lines are lines of constant temperature (isotherms), and blue flags indicate wind speed and direction in knots. Source: http://www.spc.noaa.gov/cgi-bin-spc/getuadata.pl?MyDate1=151224&Time1=12&MyDate2=&Time2=12&align=V&Levels=500

The remainder of winter

A weather pattern shift occurred in the beginning of January causing Raleigh to experience below normal conditions for both temperature and precipitation thus far. The AO shifted negative, which caused the temperature pattern to be below/around normal. The remainder of January should be below normal for temperature and precipitation. If the storm tracks follow along the southern states and into the Gulf of Mexico, we could see a winter storm. As for February and March, the climate models indicate that the temperature could swing either direction (above or below normal) and the precipitation should be above normal (which is indicative of an El Nino pattern).