
Highlights
Following a record warm December, 2015 wrapped up with more abnormal climatic conditions. Nearly every state in the Southeast experienced much above normal temperature conditions (Fig. 1) and above average precipitation totals (Fig. 2). Florida, however, was around the precipitation average. Additionally, there were some significant climate anomalies throughout the year. A strong El Nino formed across the equatorial Pacific and peaked towards the end of the year. The North Atlantic hurricane season was slightly below average with 11 named storms, 4 hurricanes, and 2 major hurricanes. In October, Hurricane Joaquin interacted with an upper level low, which lead to historic rainfall amounts across the Carolinas. Around Charleston, South Carolina rainfall amounts were around 15-20 inches with isolated amounts of up to 25 inches. Severe weather swept across the south in late December, which caused tornadoes and record flooding. Lastly, Florida has its warmest year on record with an average statewide temperature of 3.3°F above normal.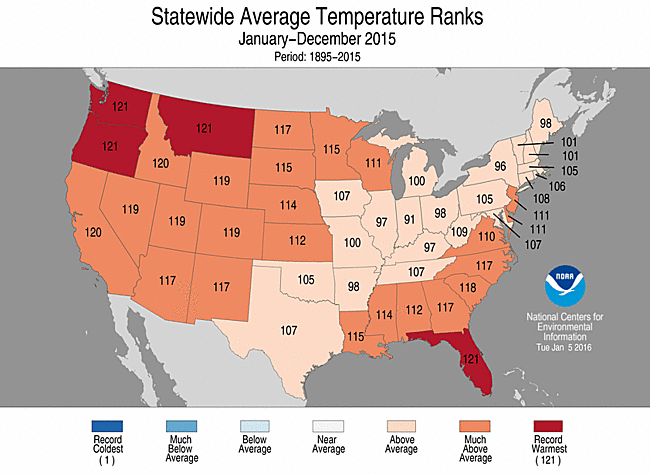 |
| Figure 1. Statewide average temperature ranks for January - December of 2015, Source: NOAA/NCEI |
 |
| Figure 2. Statewide precipitation ranks for January - December of 2015, Source: NOAA/NCEI |
Seasonal Analysis
A prominent trough remained over much of the Southeast during the winter months. Consequently, most of the states experienced a below average winter, while Florida, Georgia, and South Carolina were around normal. Most of the lower Mississippi Valley experienced drier than normal conditions while the other Southeastern states were around normal precipitation totals for remainder of the winter season.
By spring, the pattern shifted as most of the Southeast experienced above average temperatures and Florida set a new spring temperature record (4.6°F above average). Nighttime temperatures were much above normal, which allowed the average temperature to exceed above normal conditions. As for precipitation amounts, the southeast experienced a mix of climatic anomalies by the end of May. The lower Mississippi Valley had above normal precipitation amounts while Florida, North Carolina, and South Carolina experienced drier than normal conditions. The remaining Southeastern states were around their normal precipitation totals. Additionally, Tropical Storm Ana made landfall on May 10th near Myrtle Beach, South Carolina. Little damage was reported, but heavy rain fell across the Carolinas.
Florida, Louisiana, North Carolina, and South Carolina experienced much above normal temperature conditions by the end of the summer. Kentucky and Tennessee remained around average temperatures by August while the rest of the Southeastern states were warmer than average. Below-average precipitation fell across the Southeast. Combined with warm temperatures, drought conditions worsened across the lower Mississippi Valley and Southeast. In contrast, above-average precipitation fell across Kentucky, Tennessee, and Virginia. In August, remnants of Tropical Storm Erika moved across Florida, which helped alleviate drought conditions.
Every Southeastern state had an above-average fall temperature. Florida had its warmest fall on record with the statewide average around 3.6°F above the norm. As for precipitation, every state (except Florida) had above-average precipitation amounts by the end of fall. The historic flooding event in early October caused South Carolina to have its wettest fall on record with 23.76 inches (13.91 inches above average). Due to the rainfall, drought conditions improved across the entire Southeast.
Atlantic Hurricane Season
 |
| Figure 3. 2015 Atlantic hurricane season with storm tracks and strength, source: NOAA National Hurricane Center |
The 2015 Atlantic hurricane season had 11 named storms, 4 hurricanes, and 2 major hurricanes (Fig. 3). The season was slightly below the climatological mean. On average, 12.1 named storms occur with an average of 6.4 hurricanes and 2.7 major hurricanes. The lack of activity could be due to the El Nino, which tends to suppress Atlantic hurricane activity.
Two tropical storms made landfall (Ana and Bill) and no hurricane or major hurricane made landfall this season. Hurricane Joaquin did not make landfall; however, it did interact with an upper level low, which caused historic flooding in the Carolinas. This season continued the record-long streak of no major hurricane (category 3 and higher) making landfall. On average, a major hurricane makes landfall every 3 years. The last major hurricane to make landfall was Hurricane Wilma, which was November 24, 2005.
Two tropical storms made landfall (Ana and Bill) and no hurricane or major hurricane made landfall this season. Hurricane Joaquin did not make landfall; however, it did interact with an upper level low, which caused historic flooding in the Carolinas. This season continued the record-long streak of no major hurricane (category 3 and higher) making landfall. On average, a major hurricane makes landfall every 3 years. The last major hurricane to make landfall was Hurricane Wilma, which was November 24, 2005.
Severe Weather Season
 |
| Figure 4. 2015 tornado occurrences in the United States, Source: NOAA Storm Prediction Center |
For the United States, the preliminary report of tornadoes was around 1, 183. This season was below the climatological average, which is 1, 253 annually. Most months were around the climatological mean for tornado reports. However, May, November, and December were well above their respective averages. In May, there were 414 confirmed tornado reports, which is 138 above the average. In November, there were approximately 95 preliminary reports, which is 37 above the average. In December, there were 86 preliminary reports, which is 62 above average. Lastly, in the Southeastern U.S., there were no tornado reports, which was the first time that at least 1 tornado was not reported in the region.
Reference:
NOAA National Centers for Environmental Information, State of the Climate: National Overview for Annual 2015, published online January 2016, retrieved on January 28, 2016 from http://www.ncdc.noaa.gov/sotc/national/201513


