Friday, May 29, 2015

ENSO Discussion and Summer Outlook

The El Nino-Southern Oscillation (ENSO) is one of many natural climate oscillations that can alter our Earth's climate. Normally, the ocean upwells cold water off the western coast of South America, therefore causing a consistent band of thunderstorms around the equator. The thunderstorms usually propagate westward across the equatorial pacific. Sometimes, warmer than average Sea Surface Temperatures (SST) occur across the equatorial pacific causing the atmospheric circulation to temporarily switch (Fig 1).

Figure 1. The far left picture depicts El Nino conditions, the middle depicts normal conditions, and the far right depicts La Nina Conditions. Source: http://www.reefresilience.org/images/Stressors_ENSO3.png


The above average SSTs normally begin around the spring/summer and if they last til the winter, it can alter the Earth's climate (these are what we call teleconnections). The more prevalent teleconnections occur in the winter months. In the United States, during the winter months an El Nino normally (each episode is different) causes:

1. Wetter conditions in Southern California and the Southwest 
2. Warmer conditions in the Pacific Northwest 
3. Wetter and cooler conditions in the Southeast 


The Climate Prediction Center (CPC) just released the current ENSO's evolution earlier this week. CPC has issued an El Nino Advisory. Meaning, there is a 90% chance El Nino conditions will continue through the summer and an 80% chance of it lasting through the winter. Here are the latest SST anomalies: 


As you can see, there is an extensive range of above normal SSTs. They are about 1C above normal, which is pretty strong for this time of year. There is also fairly negative Outgoing Longwave Radiation, which enhances the convection (thunderstorms) and precipitation. Lastly, there are anomalous low level (850 hPa) westerly winds present. Overall, most of the models predict El Nino will persist throughout this year. If it does, it will give some relief to California because it usually causes decent rainstorms there. 

As for the summer outlook, CPC predicts normal temperature and precipitation conditions for most of NC (Fig 2). 
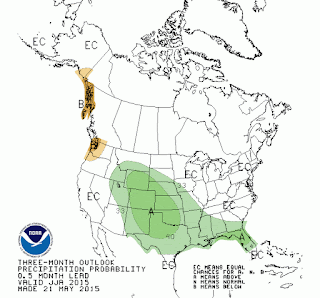


This May has been kind of dry with just 2.46" of rain thus far in Raleigh. A lot of NC is in a slight drought and hopefully it will not worsen too much. However, if El Nino conditions continue, the slight drought should be relieved. I personally like El Nino conditions because it makes for an interesting winter. We shall see. 

Cheers, 


Wednesday, May 27, 2015

Raleigh, North Carolina April Climate

I realize this is a bit overdue, but I've been extremely busy with finals and work. So, please forgive me. I've decided that after each month has ended, I will discuss the state of climate.

April is usually the start of severe weather season for the United States. I know this is bad, but I look forward to it every year. In my undergraduate years, my friends and I would chase storms all over the Southeast. It was an exciting time. 2011 was a particularly bad year with many, many destructive storms/tornadoes. North Carolina does not typically receive destructive tornadoes, but we are certainly not immune. This April was fairly quiet. There were a few thunderstorms that rolled through. In fact, I saw hail (pea size) for the first time in years. Overall, I do not recall very many severe storms in the Raleigh area.

The average temperatures and precipitation values did not depart from their norm too much. The average maximum temperature was 72.5F, which was right around normal (72.4F).


 The blue line indicates the observed maximum temperatures for each day in April. The orange line shows the "normal" maximum temperature for each day. Again, the maximum temperature for April was right around normal.

The average minimum temperature was 50.6F, which was above normal (48.03F).


The blue line is the observed minimum temperatures for every day in April. The orange line is the "normal" minimum temperature for each day. The daily temperature oscillates around the normal temperature. Keep in mind that the "normal" temperature is constructed after about 30 years of data. We do not expect the temperature to really be at or near normal every day. It simply gives us an idea of how the climate is changing. In this instance, we saw the average high temperature did not exceed the norm, while the average low temperature was above normal. A single months data is not conclusive evidence that a change is occurring, but it's important to consistently record the changes so we may better understand what direction we're headed in. Plus, this data does coincide with hypothesis that the high temperature is not getting higher, only the low temperature is increasing. 

Now, let's have a look at April's precipitation:


Overall, the total monthly precipitation was 5.28" and the normal temperature is 2.92". So, it was a relatively wet month (because the precipitation total was above normal). This is also consistent with the hypothesis that the Southeast will experience an increase in precipitation totals in the future. It would be interesting to research if any natural climate variation played a role. It's also interesting because there was a total of 14 rain producing storms in the month. 

I shall research if any climate oscillation had any influence. That's all for now. 

Cheers,