Friday, May 29, 2015

ENSO Discussion and Summer Outlook

The El Nino-Southern Oscillation (ENSO) is one of many natural climate oscillations that can alter our Earth's climate. Normally, the ocean upwells cold water off the western coast of South America, therefore causing a consistent band of thunderstorms around the equator. The thunderstorms usually propagate westward across the equatorial pacific. Sometimes, warmer than average Sea Surface Temperatures (SST) occur across the equatorial pacific causing the atmospheric circulation to temporarily switch (Fig 1).

Figure 1. The far left picture depicts El Nino conditions, the middle depicts normal conditions, and the far right depicts La Nina Conditions. Source: http://www.reefresilience.org/images/Stressors_ENSO3.png


The above average SSTs normally begin around the spring/summer and if they last til the winter, it can alter the Earth's climate (these are what we call teleconnections). The more prevalent teleconnections occur in the winter months. In the United States, during the winter months an El Nino normally (each episode is different) causes:

1. Wetter conditions in Southern California and the Southwest 
2. Warmer conditions in the Pacific Northwest 
3. Wetter and cooler conditions in the Southeast 


The Climate Prediction Center (CPC) just released the current ENSO's evolution earlier this week. CPC has issued an El Nino Advisory. Meaning, there is a 90% chance El Nino conditions will continue through the summer and an 80% chance of it lasting through the winter. Here are the latest SST anomalies: 


As you can see, there is an extensive range of above normal SSTs. They are about 1C above normal, which is pretty strong for this time of year. There is also fairly negative Outgoing Longwave Radiation, which enhances the convection (thunderstorms) and precipitation. Lastly, there are anomalous low level (850 hPa) westerly winds present. Overall, most of the models predict El Nino will persist throughout this year. If it does, it will give some relief to California because it usually causes decent rainstorms there. 

As for the summer outlook, CPC predicts normal temperature and precipitation conditions for most of NC (Fig 2). 


This May has been kind of dry with just 2.46" of rain thus far in Raleigh. A lot of NC is in a slight drought and hopefully it will not worsen too much. However, if El Nino conditions continue, the slight drought should be relieved. I personally like El Nino conditions because it makes for an interesting winter. We shall see. 

Cheers, 


Wednesday, May 27, 2015

Raleigh, North Carolina April Climate

I realize this is a bit overdue, but I've been extremely busy with finals and work. So, please forgive me. I've decided that after each month has ended, I will discuss the state of climate.

April is usually the start of severe weather season for the United States. I know this is bad, but I look forward to it every year. In my undergraduate years, my friends and I would chase storms all over the Southeast. It was an exciting time. 2011 was a particularly bad year with many, many destructive storms/tornadoes. North Carolina does not typically receive destructive tornadoes, but we are certainly not immune. This April was fairly quiet. There were a few thunderstorms that rolled through. In fact, I saw hail (pea size) for the first time in years. Overall, I do not recall very many severe storms in the Raleigh area.

The average temperatures and precipitation values did not depart from their norm too much. The average maximum temperature was 72.5F, which was right around normal (72.4F).


 The blue line indicates the observed maximum temperatures for each day in April. The orange line shows the "normal" maximum temperature for each day. Again, the maximum temperature for April was right around normal.

The average minimum temperature was 50.6F, which was above normal (48.03F).


The blue line is the observed minimum temperatures for every day in April. The orange line is the "normal" minimum temperature for each day. The daily temperature oscillates around the normal temperature. Keep in mind that the "normal" temperature is constructed after about 30 years of data. We do not expect the temperature to really be at or near normal every day. It simply gives us an idea of how the climate is changing. In this instance, we saw the average high temperature did not exceed the norm, while the average low temperature was above normal. A single months data is not conclusive evidence that a change is occurring, but it's important to consistently record the changes so we may better understand what direction we're headed in. Plus, this data does coincide with hypothesis that the high temperature is not getting higher, only the low temperature is increasing. 

Now, let's have a look at April's precipitation:


Overall, the total monthly precipitation was 5.28" and the normal temperature is 2.92". So, it was a relatively wet month (because the precipitation total was above normal). This is also consistent with the hypothesis that the Southeast will experience an increase in precipitation totals in the future. It would be interesting to research if any natural climate variation played a role. It's also interesting because there was a total of 14 rain producing storms in the month. 

I shall research if any climate oscillation had any influence. That's all for now. 

Cheers, 


Sunday, April 26, 2015

10 of the best YouTube videos on Climate Change

10 of the best YouTube videos on Climate change

The link above is the original article. To make things a little more simple, I'll post the 10 best YouTube videos on Climate Change here:

Last Week Tonight with John Oliver: Climate Change Debate (HBO)


NASA | A Year in the Life of Earth's CO2


The History of Climate Change Negotiations in 83 seconds


Climate Change | David Mitchell's Soapbox UPDATE


The Most Terrifying Video You'll Ever See


Gavin Schmidt: The emergent patterns of Climate Change 


I'm a Climate Scientist (Hungry Beast) 


Climate Change -- Those hacked emails


300 Years of Fossil Fuels in 300 seconds


13 Misconceptions about Global Warming


Thursday, April 23, 2015

Greenhouse Effect Video

After many, many hours of work and frustrated I managed to produce a video discussing the greenhouse effect. Studies and surveys show that this topic is not as understood as it should be. I hope the video provides answers and clears up any confusion. It's kind of long (9 minutes), but I hope you watch and enjoy the whole thing!

Cheers,

Aurelia

Monday, April 6, 2015

Perceptions

By R. Mosco via the nib.com 

I'm a little late on last months climate analysis, but I find it relevant for this post, which is titled "Perceptions." I've discovered that most people (including myself) are convinced our perception of past events is fact. When a particular day is cold I find myself thinking, "this is the coldest day I've ever felt" or if a storm causes flooding I think, "this is the worst flooding I've ever seen!" Our memories are bias, but we're convinced it's fact. Data is a wonderful, wonderful tool. One of the things I love about science is data, and numbers do not lie.

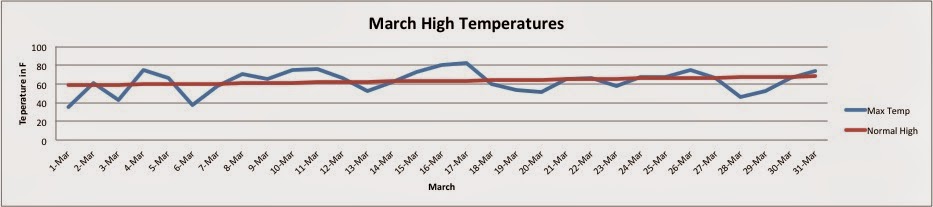
After a cold February and start of March, winter seemed like it would never end. I remember Raleigh peaking at 80 F a few times, and I was convinced that March would be another below normal month. At the end of March, I gathered the data. Here's the March climate for Raleigh:

Fig 1 shows the max daily temperature in blue and the normal high temperature in red. 

We see the maximum daily temperature oscillates around the normal high temperature. The normal high temperature is calculated by averaging the daily recorded value. Overall, the average high temperature for March was 62.7 F and the normal high temperature for March is 63.4 F. So, the average max temperature of March was slightly below average (0.7 F), but it's safe to say that it was "normal." 

Fig 2 shows the minimum daily temperature in blue and the normal low temperature in red. 

In figure 2 we see the daily low temperature linger around the normal low temperature. The average low temperature for March was 39.8 F and the normal low temperature for March is 39.9 F. Therefore, the average min temperature of March was barely below average (0.1 F). Again, the average min temperature is considered "normal." 

In conclusion, the month of March in Raleigh was a normal March (even though it felt cooler than normal). I was actually surprised to find that March was normal! 

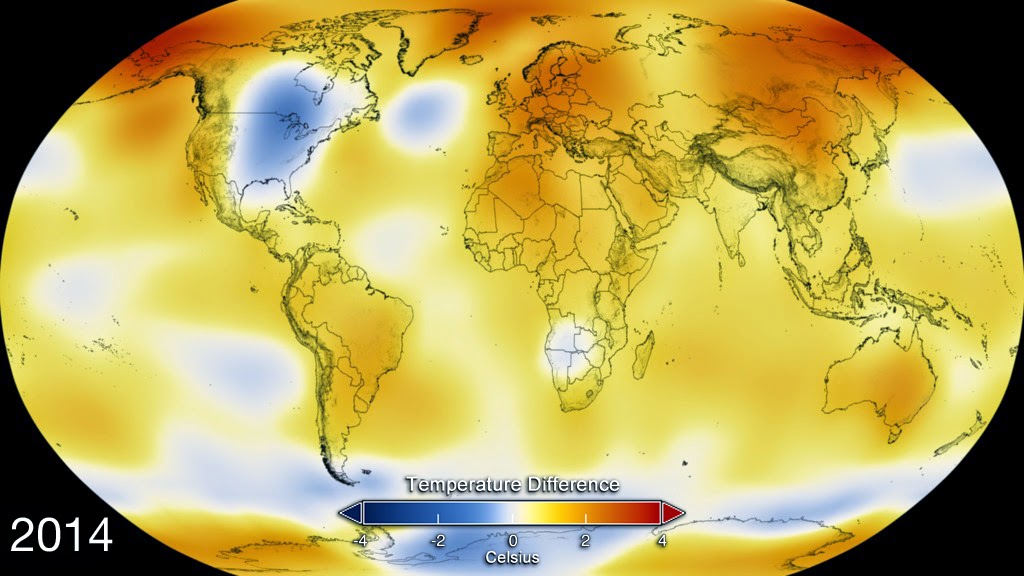
This is a great example of how our perceptions of the past are not great indicators of what actually happened. I hear variations of this phrase quite often: "It was so cold this month, Climate change is not happening!" I have two things to say on the matter. One, it's important to remember when looking at climate change or global warming, we're looking at the average temperatures for the entire globe. Take the year 2014 for example. Most of the Eastern United States experienced below average winters, while the rest of the globe experienced above average temperatures. In fact, the year 2014 was the warmest year on record. Let's take a look at the following picture from NASA


The yellow, orange, and red colors indicate areas of warming while blue indicates areas of cooling. This image is a great way to see the Earths deviations all together. So, yes, it was cooler than average in the Eastern United States, but when we incorporate observations from the rest of the planet, we see an above average year. 
Second, when particular areas experience cooler than average seasons or months, it does not indicate climate change is not occurring. When studying the complex climate we live in, we compare new data to that of data from hundreds and sometimes thousands of years ago. 

Climate Change is still a sensitive topic and it's very easy to say it's not happening because of a few anomalies. Therefore, it's prudent that correct information is published and explained to the general public, so we can avoid more confusion in the future. 


Tuesday, March 31, 2015

What Do Americans believe?

Recent studies have concluded that the nearly half of Americans believe that Anthropogenic Climate Change is occurring. Pew Research Center conducted a survey in 2014 and concluded about 61% of Americans believe there is solid evidence that the Earth is warming (Motel 30.3.15). Motel continues by stating that 48% of Americans believe it's a top concern. The top concerns were possible terrorists attacks and the nuclear plans of Iran and North Korea. As time passes, scientific evidence continues to indicate humans have influence the climate and scientific consensus continues to rise, too. A recent opinion survey showed that there's still a significant gap between the general public and scientists. The poll concluded that about 50% of the general public and 87% of scientists believe that climate change is mostly due to human activity.

Fig 1. Shows the percent of Americans that believe in Global warming and how many view it as a major threat. 


Honestly, I found these studies quite surprising. I feel like I spend a lot more time discussing how we know humans have influenced the climate than what we can do to fix the problem. However, I still remain quite optimistic after reading these studies. I think society is moving in the right direction. As scientific consensus increases, the public is sure to follow. Since more a more people understand that there is a problem, it is our job to introduce solutions.


Works Cited:
Motel, Seth. "Polls Show Most Americans Believe in Climate Change, but Give It Low Priority." Pew Research Center RSS. 23 Sept. 2014. Web. 1 Apr. 2015. <http://www.pewresearch.org/fact-tank/2014/09/23/most-americans-believe-in-climate-change-but-give-it-low-priority/>.

Saturday, March 28, 2015